What it measures
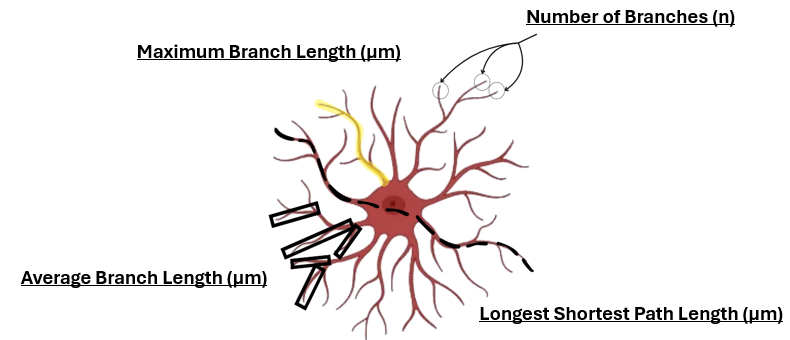
Number of branches n
Segments of the skeleton between junctions and/or end-points.
Maximum branch length µm
Length of the single longest branch.
Average branch length µm
Mean length of all the branches of the cell.
Longest shortest path µm
The longest of the shortest routes between two points of the skeleton: how far the arbour extends.
Tap a variable to see what it means.
Caveat!!! Runs on a 2D max-intensity projection… → flattening bias (processes in other planes are lost)
Next: SNT tracing
Traced through the whole Z-stack
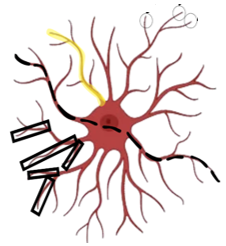
Z-Stack
Volume µm³
Because the paths are traced in 3D (x, y and z), SNT can estimate the volume of the processes — something a flat 2D skeleton cannot give.
Cable length µm
Total length of all the traced paths added together.
Number of branches n
Branches of the traced arbour.
Longest shortest path µm
Same idea as in the skeleton, now measured on the 3D tracing.
Works in 3D: avoids the flattening bias of the skeleton. This is where the volume variable comes from!!
Next: Sholl on this same cell
One value per radius
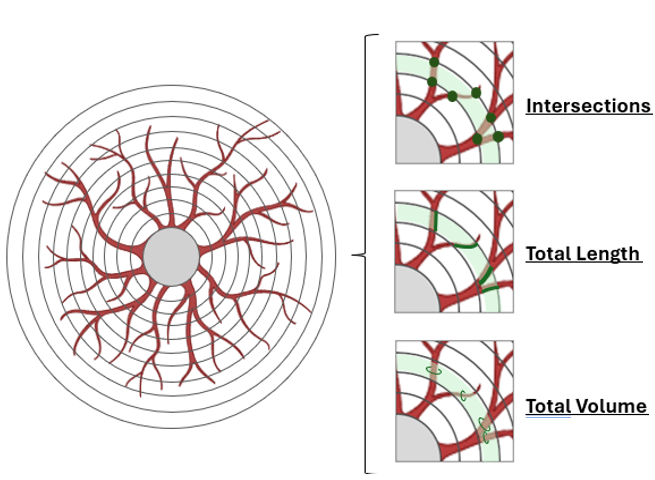
Intersections n
How many processes cross each circle.
Total length µm
Length of the processes inside each shell between two circles.
Total volume µm³
Volume of the processes inside each shell — available thanks to the 3D tracing.
Concentric circles from the soma. Per radius: intersections, length and volume vs distance from the soma
At a glance
1Skeleton
- 2D projection
- Branches, branch lengths, longest shortest path
2SNT tracing
- 3D tracing
- Adds cable length and volume
3Sholl
- On the same 3D tracing
- Complexity vs distance from the soma